Hounsfield Units in CT, Measured: Building a 3D HU Volume from DICOM with pydicom
What are the HU values of air, lung, fat and muscle on CT? We measure them on a public chest CT with pydicom instead of copying a table, and show three traps real DICOM data sets: file order, -2048 HU padding and uint16 wrap-around.
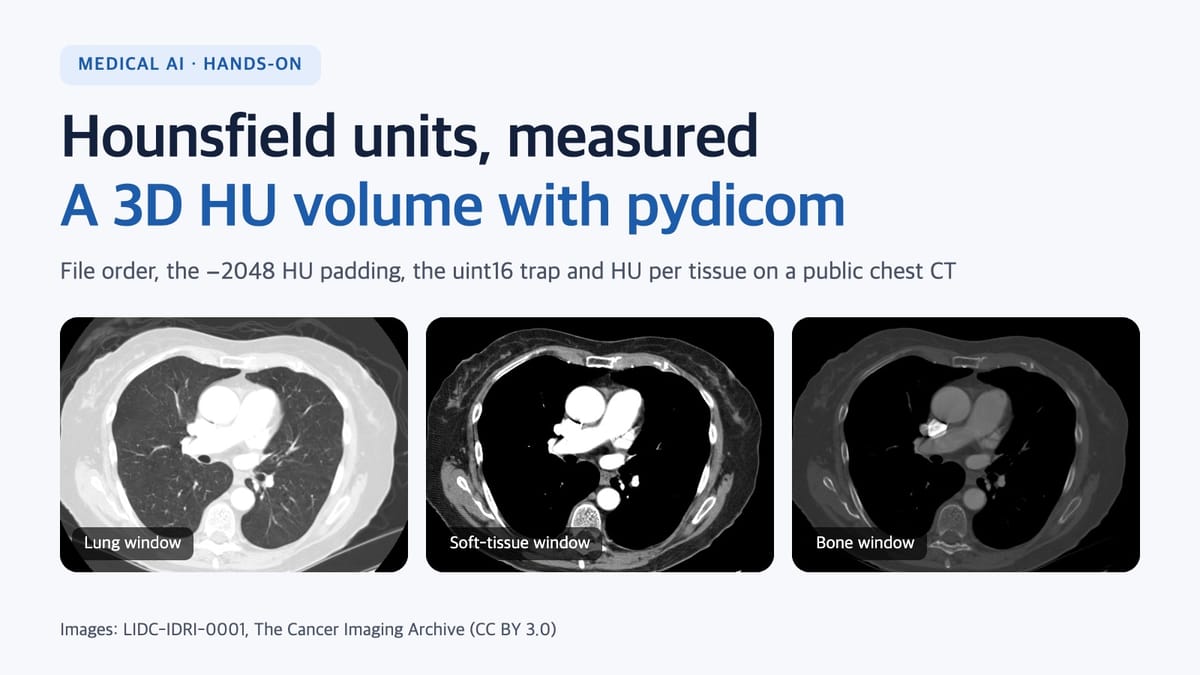
What are the Hounsfield unit (HU) values of air, lung, fat, muscle and blood on a CT scan? Most answers are a table copied from somewhere else. This post measures them instead. We download one public chest CT, turn its DICOM folder into a 3D HU volume with pydicom, put regions of interest on air, lung, fat, muscle, liver, spleen, the aorta and the spine, and compare what we get with the textbook ranges. Along the way, three traps that real data set for anyone building a CT pipeline show up as numbers.
Every code block here was run, and every number in the post comes from that run:
- Python 3.15, pydicom 3.0.2, NumPy 2.5.4, SciPy 1.18.1, matplotlib 3.11
- Data: one chest CT series of LIDC-IDRI-0001 (The Cancer Imaging Archive, CC BY 3.0)
Hounsfield units in one line
The Hounsfield unit rescales each voxel's X-ray attenuation coefficient μ so that water and air sit at fixed points:
HU = 1000 × (μ − μ_water) / (μ_water − μ_air)By definition, water is 0 HU and air is −1000 HU. Every other tissue value is a measurement, not a definition. That is why published ranges differ from source to source, and why scanner settings and contrast agent move them. Measuring them yourself teaches more than memorising a table.
1. Download a public CT
We use the first patient of the LIDC-IDRI collection in The Cancer Imaging Archive (TCIA), a public medical imaging archive funded by the US National Cancer Institute. The API needs no login.
# series list for patient LIDC-IDRI-0001 (JSON)
curl -s "https://services.cancerimagingarchive.net/nbia-api/services/v1/getSeries?Collection=LIDC-IDRI&PatientID=LIDC-IDRI-0001&format=json"

# download the CT series (133 images): about 35 MB zipped, 67 MB unzipped
curl -s -o series.zip "https://services.cancerimagingarchive.net/nbia-api/services/v1/getImage?SeriesInstanceUID=1.3.6.1.4.1.14519.5.2.1.6279.6001.179049373636438705059720603192"
mkdir -p lidc && unzip -q series.zip -d lidc
LIDC-IDRI is licensed CC BY 3.0, and using it means citing the dataset and its paper (see the references). TCIA's terms also forbid trying to identify the participants.
2. Read the header before the pixels
These are the header values from the first image that matter for HU and geometry:
| Attribute | Value | Meaning |
|---|---|---|
| RescaleSlope / RescaleIntercept | 1 / −1024 | HU = 1 × stored value − 1024 |
| PixelRepresentation, BitsStored | 1, 16 | Signed 16-bit integers (pydicom returns int16) |
| PixelSpacing | 0.703125 × 0.703125 mm | Row and column pixel spacing |
| SliceThickness | 2.5 mm | Nominal slice thickness |
| WindowCenter / WindowWidth | −600 / 1600 | The stored display window (a lung window) |
| PixelPaddingValue | 63536 | Says what the padding is; as we'll see, it's wrong |
| KVP, ConvolutionKernel | 120, STANDARD | Tube voltage and reconstruction kernel |
3. Trap 1: file-name order is not slice order
The first five files sorted by name, with their InstanceNumber and z position:
| File | InstanceNumber | z (mm) |
|---|---|---|
| 00000001.dcm | 80 | −207.5 |
| 00000002.dcm | 52 | −137.5 |
| 00000003.dcm | 42 | −112.5 |
| 00000004.dcm | 59 | −155.0 |
| 00000005.dcm | 28 | −77.5 |
Stack them by name and you get a volume with the anatomy shuffled, and no error. So we take the slice normal n from ImageOrientationPatient and sort by each slice's ImagePositionPatient projected onto n. After sorting, the 133 slices ran from −340 mm to −10 mm and all 132 gaps were exactly 2.5 mm. In this series InstanceNumber ran exactly opposite to z (the lowest slice is number 133), so sorting by InstanceNumber gets the order right but the volume upside down.
ct_volume.py:
import sys
from collections import defaultdict
from pathlib import Path

import numpy as np
import pydicom


def load_series(folder):
    """Group the DICOM files in a folder by SeriesInstanceUID (pixels not read yet)."""
    series = defaultdict(list)
    for path in Path(folder).rglob("*.dcm"):
        ds = pydicom.dcmread(path, stop_before_pixels=True)
        if ds.get("Modality") == "CT" and "LOCALIZER" not in ds.get("ImageType", []):
            series[ds.SeriesInstanceUID].append((path, ds))
    return series


def sort_slices(items):
    """Sort by position along the slice normal, not by file name or InstanceNumber."""
    iop = np.array(items[0][1].ImageOrientationPatient, dtype=float)
    normal = np.cross(iop[:3], iop[3:])
    pos = [float(np.dot(normal, np.array(ds.ImagePositionPatient, dtype=float))) for _, ds in items]
    order = np.argsort(pos)
    return [items[i] for i in order], np.array(pos)[order]


def to_hu(ds):
    """Stored value -> HU. Read slope/intercept per slice and always compute in float."""
    slope = float(ds.get("RescaleSlope", 1))
    intercept = float(ds.get("RescaleIntercept", 0))
    return ds.pixel_array.astype(np.float32) * slope + intercept


def load_volume(items):
    items, pos = sort_slices(items)
    gaps = np.diff(pos)
    if not np.allclose(gaps, gaps[0], atol=0.01):
        raise ValueError(f"uneven slice spacing: {np.unique(gaps.round(3))}")
    vol = np.stack([to_hu(pydicom.dcmread(p)) for p, _ in items])  # (z, y, x)
    row_mm, col_mm = (float(v) for v in items[0][1].PixelSpacing)
    return vol, (abs(float(gaps[0])), row_mm, col_mm), items


if __name__ == "__main__":
    series = load_series(sys.argv[1])
    uid, items = max(series.items(), key=lambda kv: len(kv[1]))
    vol, spacing, items = load_volume(items)
    print("shape (z,y,x):", vol.shape, "spacing mm (z,y,x):", spacing)
    print("HU min/max:", vol.min(), vol.max())
$ python ct_volume.py lidc
shape (z,y,x): (133, 512, 512) spacing mm (z,y,x): (2.5, 0.703125, 0.703125)
HU min/max: -2048.0 3071.0Reading the 133 sorted slices into an HU volume took about 0.1 s on a laptop (Apple M4). The spacing check is strict on purpose: stopping on a series with a missing or duplicated slice is better than passing it silently.
4. Trap 2: integer arithmetic wraps around
This series stores signed int16, so it's safe. But for data with PixelRepresentation 0, pydicom returns a uint16 array, and adding the intercept in integer arithmetic makes NumPy wrap the values without a warning:
import numpy as np

stored = np.array([24, 3000], dtype=np.uint16)
print(stored - 1024)            # [64536  1976]  <- 24 - 1024 becomes 64536
print(stored.astype(np.float32) * 1.0 - 1024)   # [-1000.  1976.]
A voxel that should be −1000 HU (air) became 64536. That is why to_hu() converts to float32 first. pydicom's own pydicom.pixels.apply_rescale() works too: on every slice of this series it gave exactly the same values as to_hu() (maximum difference 0, result dtype float64).
5. Trap 3: 21% of the volume is neither body nor air
The minimum above, −2048 HU, is lower than air (−1000). Counting the most common values in the whole volume:
| HU | Share of the volume | What it is |
|---|---|---|
| −2048 | 21.28% | Padding outside the circular reconstruction field of view (stored −1024) |
| −1024 | 3.30% | Stored value 0 |
| −1012 | 0.58% | Near air |
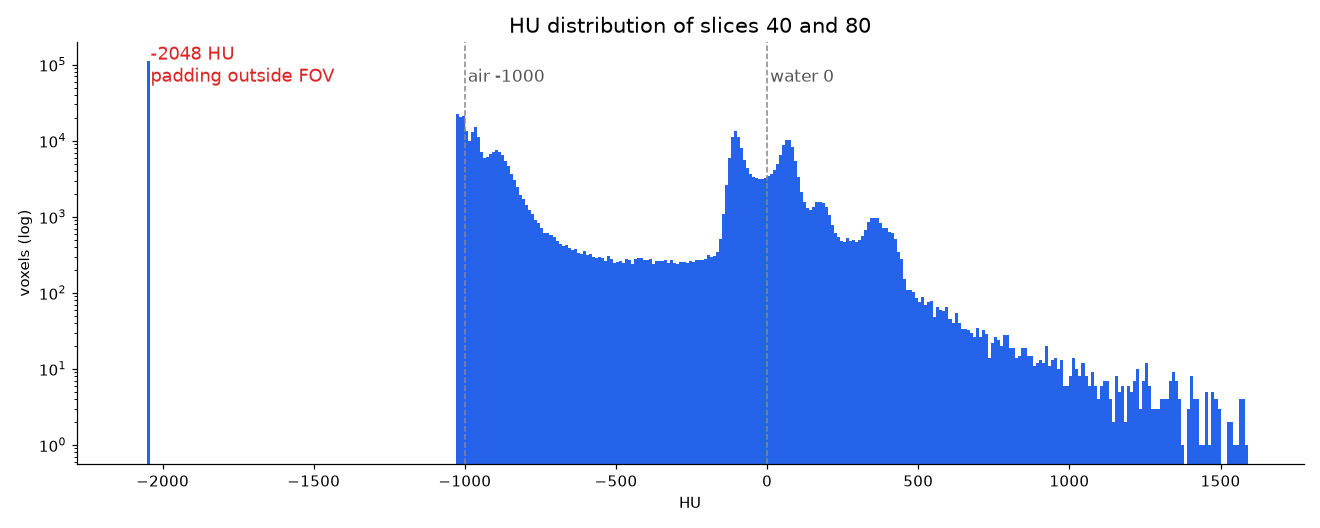
CT reconstructs a circle, but the corners of the 512 × 512 square still need values. This scanner filled them with −2048 HU. The header's PixelPaddingValue, though, is 63536, which read as a signed 16-bit integer is −2000, and the volume has no −2000 anywhere. Don't trust the header's padding value; look at the histogram.
What happens if you leave the padding in:
- Statistics shift. The mean HU of slice 80 is −861.1 over the whole slice and −540.3 inside the field of view.
- Min-max normalisation breaks. The volume minimum becomes −2048 instead of about −1000, which squeezes the range real tissue uses. That is one reason to clip to a fixed HU range before normalising.
- Resampling smears it. Linear interpolation mixes −2048 with the air outside the body at the edge of the field of view. The resampling code below replaces the padding with −1024 first.
6. Measuring HU per tissue
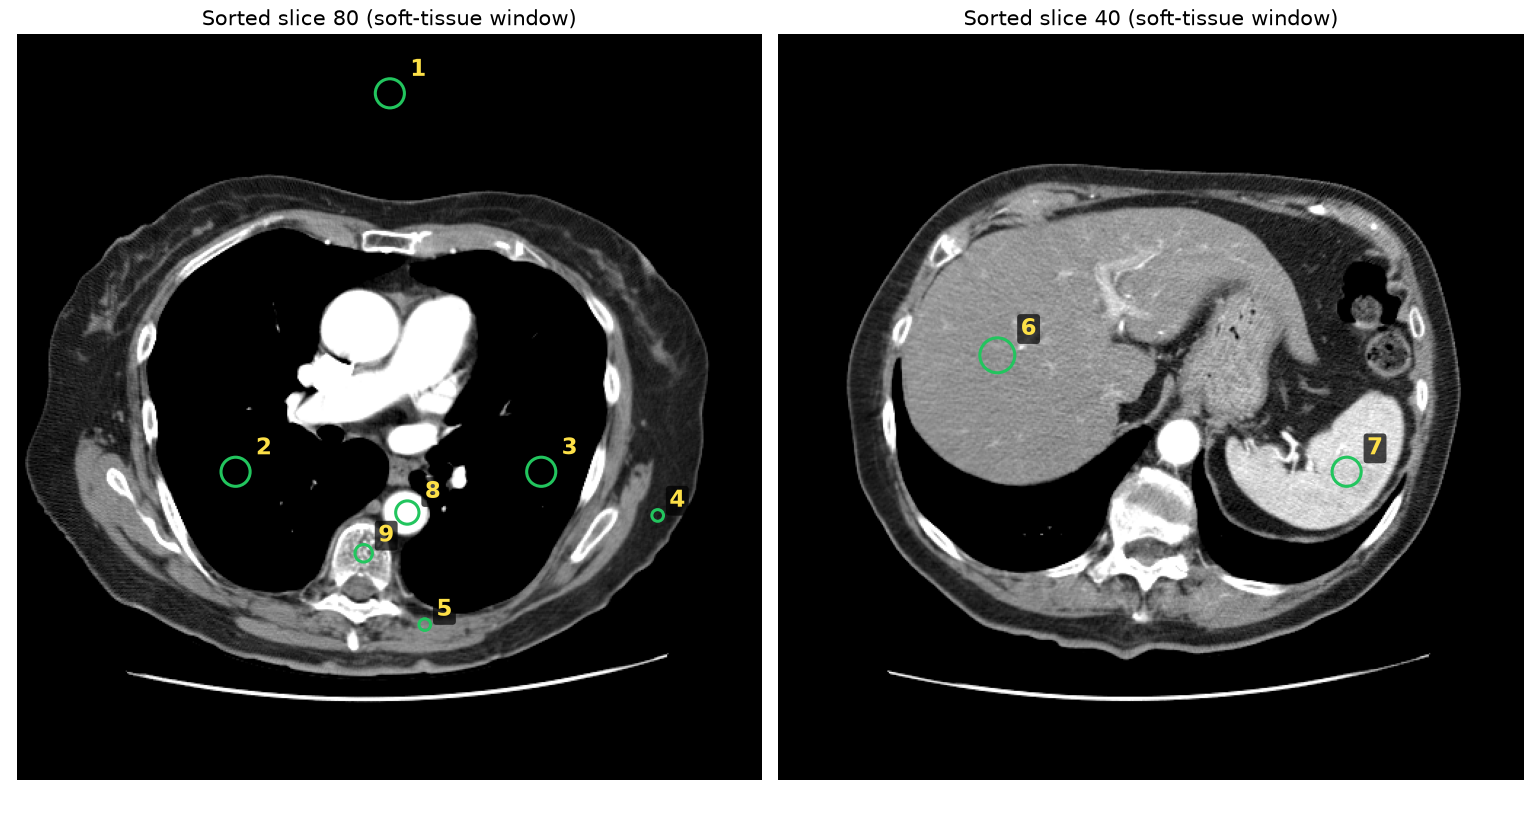
We picked two slices from the sorted volume, placed circular regions of interest (ROIs) and measured the mean and standard deviation. Slice 80 is the chest below the aortic arch; slice 40 is the upper abdomen with the liver and spleen. This is a contrast-enhanced scan (the aorta is bright).
import numpy as np

def roi_stats(vol, k, x, y, r):
    """Mean and SD of HU inside a circle of radius r px centred at (x, y) on slice k."""
    yy, xx = np.mgrid[: vol.shape[1], : vol.shape[2]]
    v = vol[k][(xx - x) ** 2 + (yy - y) ** 2 <= r * r]
    return round(float(v.mean()), 1), round(float(v.std()), 1), int(v.size)

print(roi_stats(vol, 80, 440, 330, 4)) # subcutaneous fat -> (-110.3, 6.5, 49)| # | ROI | Measured (mean ± SD, HU) | Voxels | Reference range (HU) |
|---|---|---|---|---|
| 1 | Air (outside the body, inside the FOV) | −1010 ± 13 | 317 | −1000 (definition) |
| 2 | Lung (right) | −904 ± 20 | 317 | −700 to −600 |
| 3 | Lung (left) | −877 ± 22 | 317 | −700 to −600 |
| 4 | Subcutaneous fat | −110 ± 7 | 49 | −120 to −90 |
| 5 | Paraspinal muscle (erector spinae) | 45 ± 17 | 49 | +35 to +55 |
| 6 | Liver (contrast-enhanced) | 72 ± 15 | 441 | 60 ± 6 |
| 7 | Spleen (contrast-enhanced) | 173 ± 22 | 317 | Soft tissue on contrast CT +100 to +300 |
| 8 | Descending aorta (contrast-enhanced) | 436 ± 18 | 197 | +13 to +50 (unclotted blood) |
| 9 | Vertebral body (cancellous bone) | 116 ± 50 | 113 | +300 to +400 |
The reference ranges come from the table in Wikipedia's "Hounsfield scale" article, which cites a different original source for each row (reference 4). How to read the results:
- Values that match: air at −1010, fat at −110 and muscle at 45 HU are where they should be. Air reading 10 HU below −1000 is normal: measurements carry noise and calibration error.
- Values the contrast agent changed: the aorta's 436 HU is iodine contrast, not blood. The liver's 72 HU is above the table's 60 ± 6, and the spleen's 173 HU falls in the table's "soft tissue on contrast CT" range. The same organ's HU changes a lot with contrast and scan phase, so check whether your training data mixes phases.
- Values that differ from the table: the lungs measured −877 to −904 HU, below the table's −700 to −600. Lung HU depends heavily on how deep the breath was. The vertebral body's 116 HU is also below the table's cancellous bone range; bone HU varies with age, bone density and where you measure, so one number says nothing about bone density on its own.
- ROI placement changes the number: six ROIs of radius 4 px on the back muscles of slice 80, at (190, 410), (205, 408), (215, 405), (265, 410), (280, 405) and (300, 410), read 24.5 to 44.6 HU. One more beside the spinous process, at (242, 415), read −12.1 HU (SD 47) because it caught fat between the muscles (partial volume). A fixed threshold such as "muscle is 40 HU" would miss much of this muscle.
7. Same HU, different window
Windowing maps one slice of the HU range to grey levels for display. The window stored in this series' header was a lung window (−600 / 1600).
def window(img, center, width):
    lo, hi = center - width / 2, center + width / 2
    return ((np.clip(img, lo, hi) - lo) / (hi - lo) * 255).astype(np.uint8)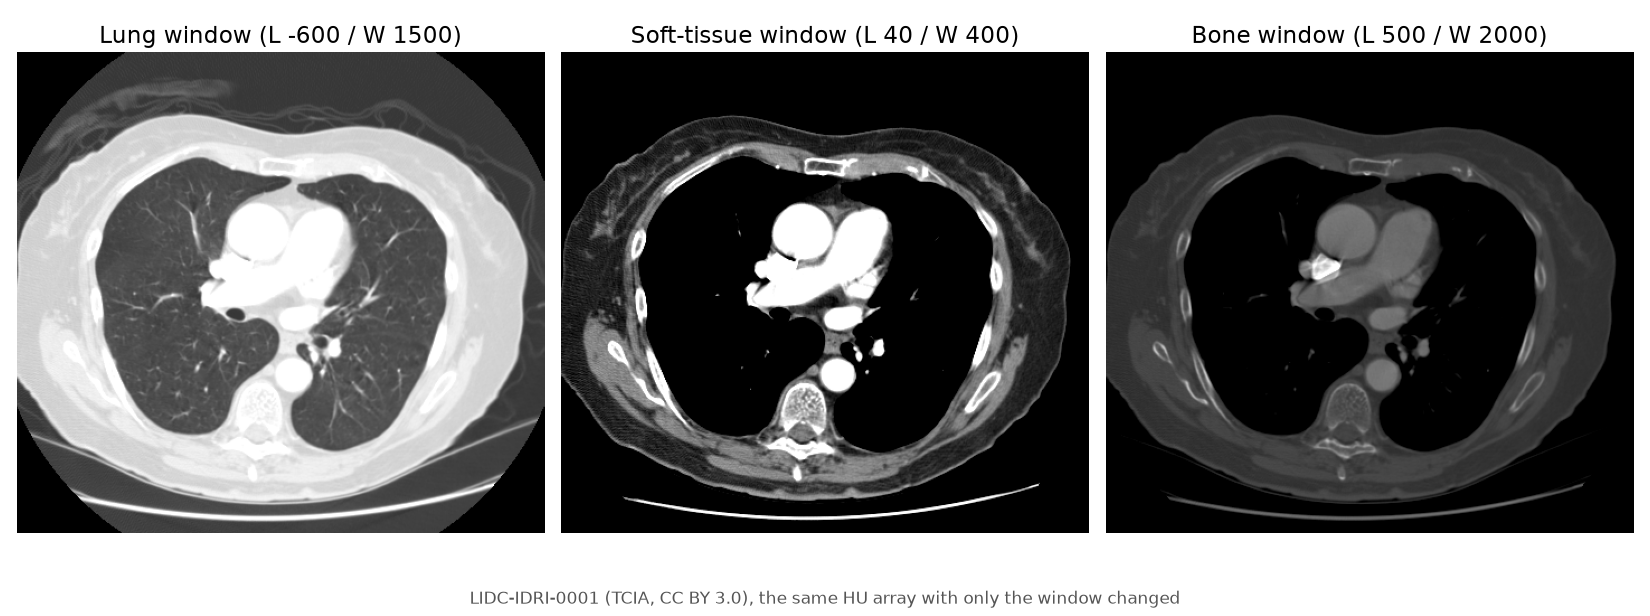
A window only chooses what to display or feed to a model; it doesn't change the HU. Measure and compute statistics on the HU array before windowing.
8. Resampling to a 1 mm isotropic volume
The voxels here are 0.70 × 0.70 × 2.5 mm, 3.6 times longer in z. For 3D models or measuring lengths, you usually resample to isotropic voxels.
from scipy import ndimage

outside = vol <= -2000                                  # padding outside the FOV
vol_clean = np.where(outside, -1024, vol)              # replace with air before interpolating
iso = ndimage.zoom(vol_clean, zoom=spacing, order=1)   # spacing = (2.5, 0.703125, 0.703125)
print(iso.shape)                                       # (332, 360, 360)
The zoom factor is current spacing ÷ target spacing, so for a 1 mm target it is the spacing itself. The volume went from (133, 512, 512) to (332, 360, 360) in 0.81 s with linear interpolation (order=1), 172 MB as float32. It also shows that the same array size can cover different physical sizes: the 512 pixels covered 360 mm and the 133 slices 330 mm. When you resample a label mask with the image, use order=0 (nearest neighbour) so class values don't blend.
Checklist
- Group by SeriesInstanceUID and drop localizers.
- Sort by ImagePositionPatient along the slice normal, not by file name or InstanceNumber, and check that the spacing is even.
- Read slope and intercept per slice and convert to float before computing.
- Find the padding outside the field of view with a histogram; don't rely on PixelPaddingValue alone.
- Check contrast and phase before interpreting HU.
- Measure on HU before windowing, and clip to a fixed range before normalising.
- Clean the padding before resampling, and resample masks with nearest neighbour.
The code blocks above reproduce every table and number in this post. The ROI coordinates, in table order as (slice, x, y, radius), are (80, 256, 40, 10), (80, 150, 300, 10), (80, 360, 300, 10), (80, 440, 330, 4), (80, 280, 405, 4), (40, 150, 220, 12), (40, 390, 300, 10), (80, 268, 328, 8), (80, 238, 356, 6). Slice numbers refer to the volume sorted by ascending z.
This post is also available in Korean.
References
- Armato SG III, et al. The Lung Image Database Consortium (LIDC) and Image Database Resource Initiative (IDRI): A completed reference database of lung nodules on CT scans. Medical Physics 38(2):915–931, 2011. doi:10.1118/1.3528204
- Armato SG III, et al. Data From LIDC-IDRI [Data set]. The Cancer Imaging Archive, 2015. doi:10.7937/K9/TCIA.2015.LO9QL9SX
- Clark K, et al. The Cancer Imaging Archive (TCIA): Maintaining and Operating a Public Information Repository. Journal of Digital Imaging 26(6):1045–1057, 2013. doi:10.1007/s10278-013-9622-7
- Wikipedia, Hounsfield scale (the HU formula and the per-tissue reference table; see that page for each row's original source).
- DICOM PS3.3, C.8.2.1 CT Image Module (Rescale Slope/Intercept), C.7.6.2 Image Plane Module (ImagePositionPatient, ImageOrientationPatient, PixelSpacing).
- pydicom documentation, pydicom.pixels.apply_rescale.